Why did I do this?
This project started out of my curiosity in biology class of whether there will be patterns in noisy moisture increments. The ultimate purpose of this project, however, is to enhance disaster production with greater accuracy so that no one is dying of wrong weather forecasts of extreme disaster.
Easy Overview
Inspiration & Research Question
This project, which is one of my favorites, started from curiosity in AP Biology class. We were learning about hydrogen bonds in water and I learned that moisture, basically water vapor held together by hydrogen bonds, is the cause of most extreme weather disasters. Storms and flood kill thousands of people every year. At the same time I was reading ISEF-winning papers for fun. It was Matteo Paz’s work on pulling real signals out of what looked like pure noise in space telescope data. So I thought: what if I apply this in the moisture and what if the “noise” in weather moisture data wasn’t random after all?
Weather models take raw moisture data, also collect them using satellites, weather stations, and physics, put it into one formula, and recalculate moisture data. Scientists treat the difference between the raw forecast and the final corrected data, or recalculated data through reanalysis, as random error. I call this random error “moisture increment”, or Δq. Everyone assumes that there is no pattern and it is random error and noise. I decided to question this.
Designing and Conducting the Research
I pulled hourly moisture data from the ECMWF ERA5 reanalysis dataset, focusing on 2019–2021 over the western U.S. at three pressure levels and 12-hour intervals (i tried computing over 1940 to present. It literally almost melted my laptop, so I had to shrink the range of time). Then the web interface kept timing out, so I switched to the API and still waited half a day for the files to arrive. Basic formula for moisture increment is simple:

Iteration and Scientific Challenges
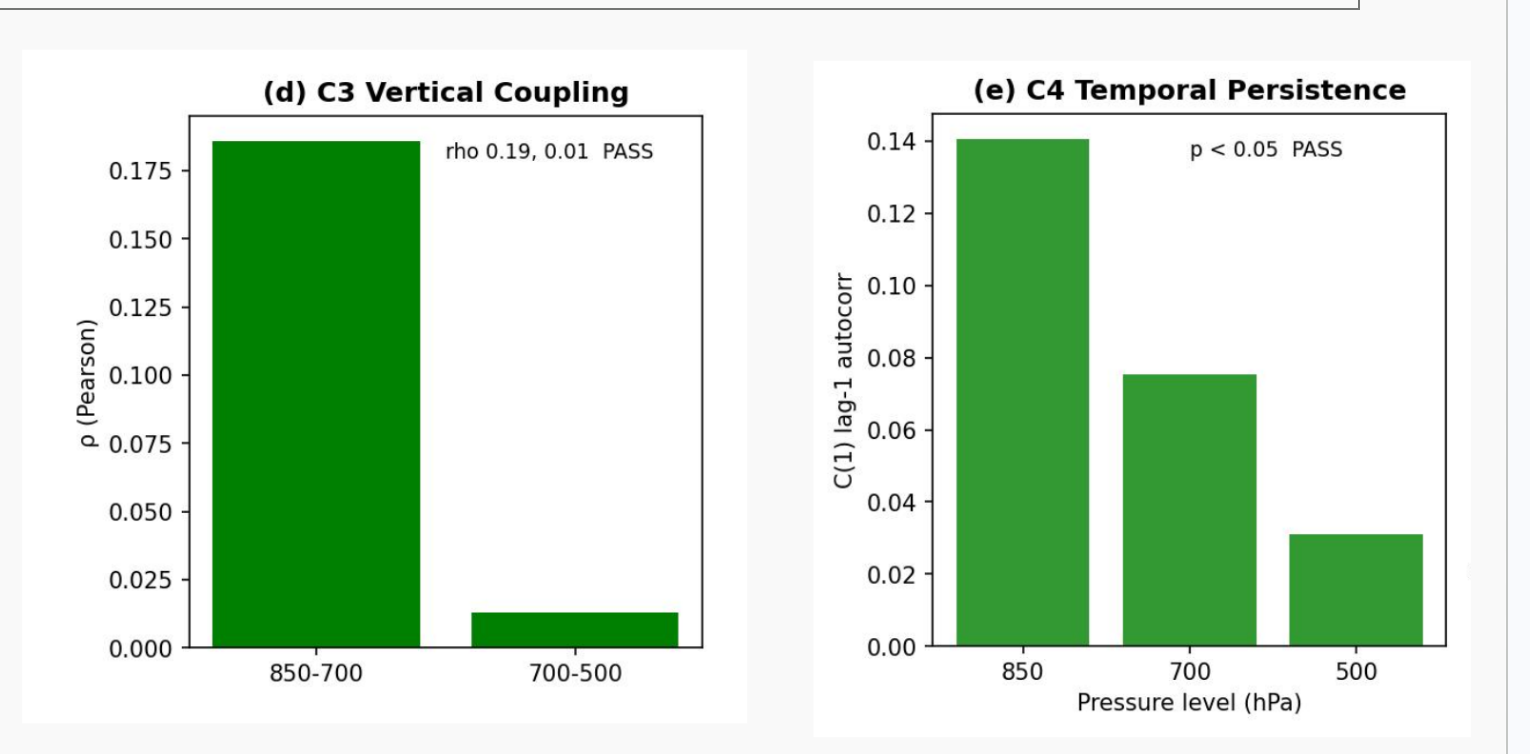
Once the data was in, the first two tests I ran were spatial recurrence and connected-component geometry, which failed completely with p-values of 1.0 and 0.3. The good news was that I conducted a vertical coupling and temporal persistence test and had p-values of zero. This means that there is a vertical pattern and across-time pattern in the moisture increment. I proved that patterns exist vertically and temporally.
There were no labels in the dataset, instead of supervised methods, I used unsupervised machine learning to find hidden patterns (also called regime) in moisture dataset: HMM, k-means, GMM, and self-organizing maps. One regime R4 was interesting! R4 was a high-magnitude correction that was vertically aligned. It showed up most in summer, where moisture disaster was at peak, and it showed least during winter.
(The mistake I made was that I accidentally averaged the data over the region and lost local picture over the region. But even when I redo the entire pipeline with localized moisture data, almost same result came out. )
In correlating the regime with actual disaster, I failed a lot. One was that I did this whole process with the NOAA storm events dataset. Later, I realized that it was human-reported dataset, which means that it wasn’t accurate representation of actual weather. I switched to pure ERA5 thresholds (CAPE above the 99th percentile for storms, precipitation above the 99th for floods) and suddenly R4 regime was the most highly-correlated one. However, signal peaked at lag-zero, so it was diagnostic, not predictive. Yet, I proved that there was pattern in number that scientists once thought of as noise.
Seeking Expert Feedback & Reflection
I spent the next months emailing a few hundred professors for feedback, including a cold email to Kerry Emanuel that somehow got a reply and referral to Paul O’Gorman (I had a 30 minutes meeting with him and got feedback). I also had a meeting with Professor Di Lorenzo, where he suggested that I intern at his research group.
Log Entries
January 13th - 14th, 2026
I was casually scrolling through google to find interesting research to read about. I found out that many ISEF winners published super cool research paper and decided to read about it. One is “ICOR: improving codon optimization with recurrent neural networks” by Rishab Jain. To summarize, he is creating DNA for vaccine is a high-risk activity, as many codons coding the DNA in vaccines are unstable and rare. What he did is that he tried to find non-redundant, yet still robust gene by using AI to studying codon usage bias. I couldn’t finish the article because I had Chinese homework coming up, but it seemed like a great project.
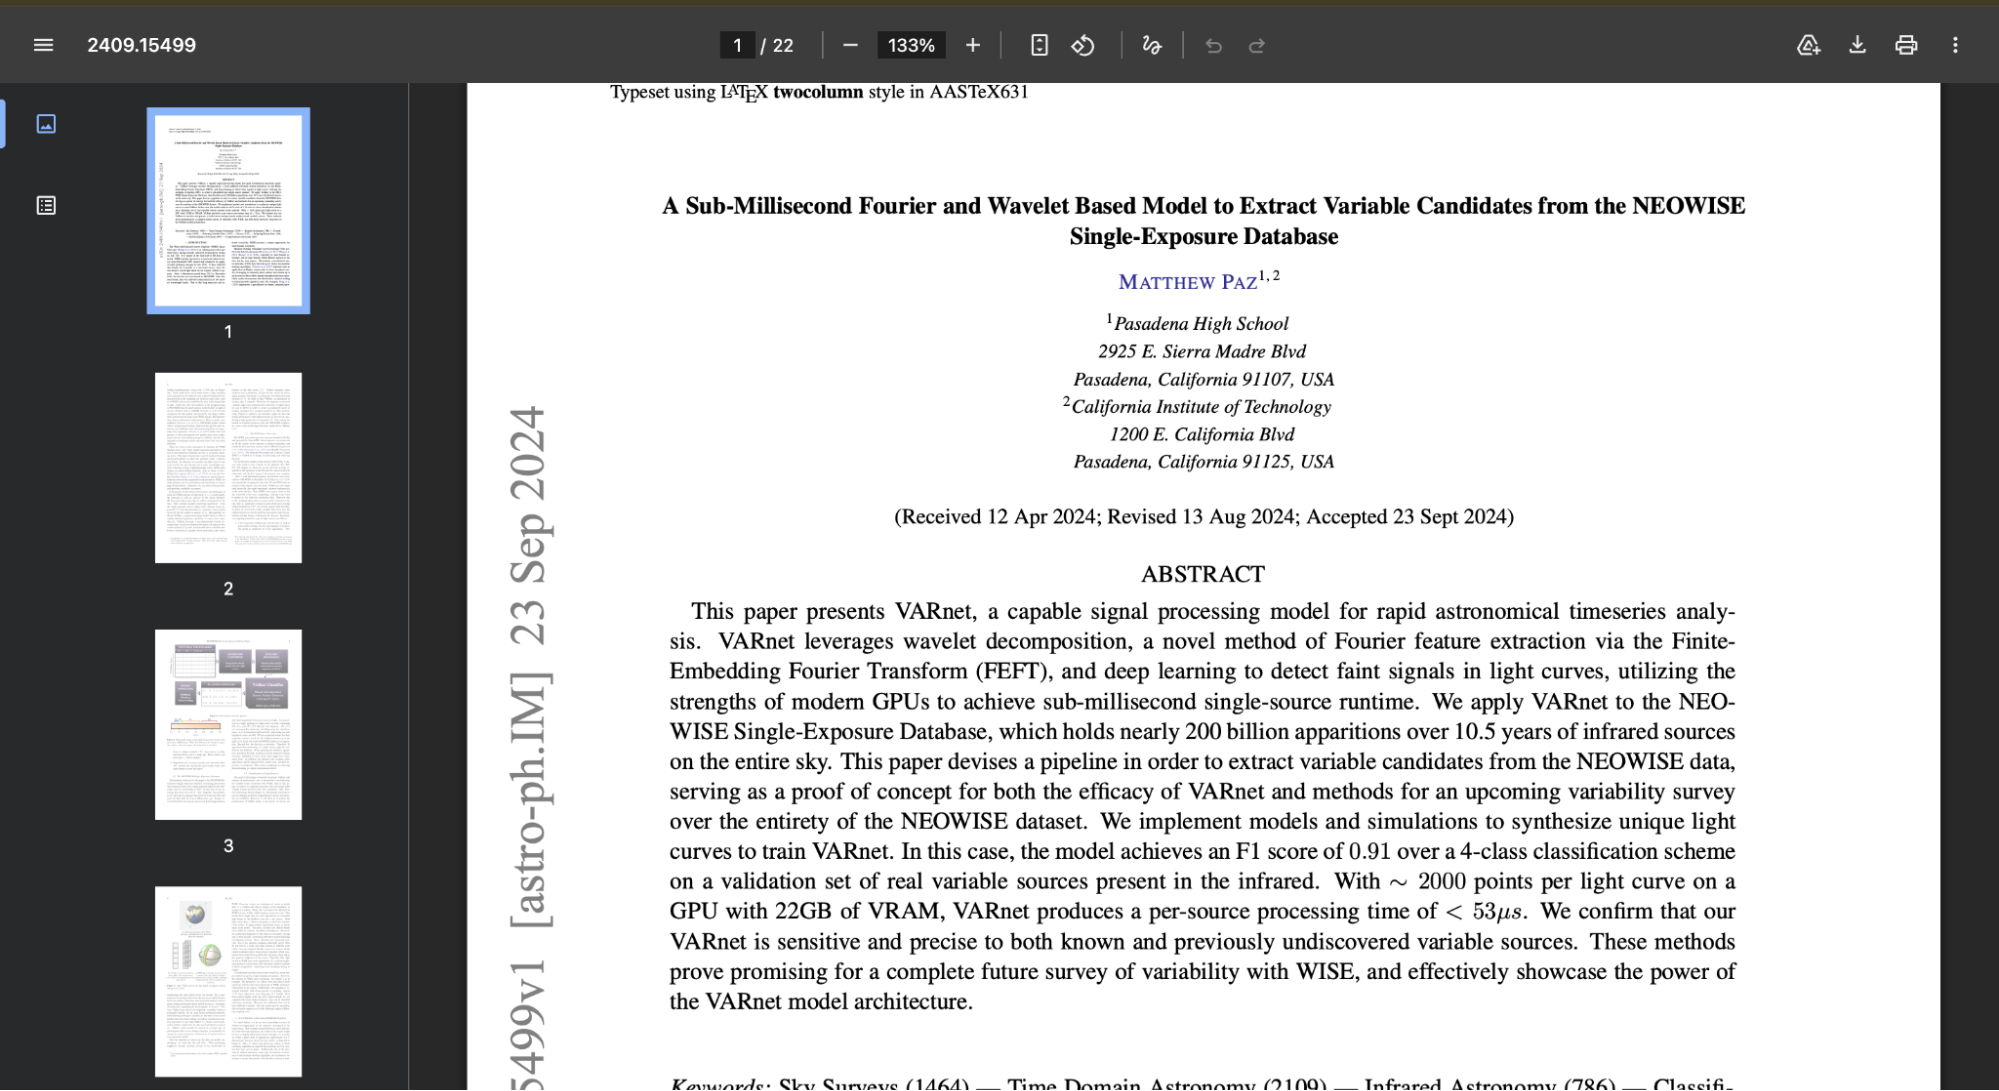
The next paper I read was super interesting, which was “A Sub-Millisecond Fourier and Wavelet Based Model to Extract Variable Candidates from the NEOWISE Single-Exposure Database”. Simply put, it was extracting noise in space wave data taken by NEOWISE Single-Exposure Database, use bunch of deep learning techniques like Finite-Embedding Fourier Transform, and use it to discover new stars that are not yet found. What was profounding was that he tried to find pattern in meaningless data and used it to make a scientific discovery.
It was AP Bio class. We were learning about hydrogen bond in water, where I came to realize that moisture, which are made out of bunch of water molecules bonded by hydrogen bond, is the root of most of the extreme weather disaster. At the same time, it is that extreme weather disaster that is killing thousands of people around the world annually (who knows? Maybe some gigantic hurricane will arrive to earth and destroy the entire humanity?). I immediately decided to take inspiration from Matteo Paz’s article and use machine learning to find pattern in moisture dataset and use that to predict extreme weather (yep hopefully it should work).
January 15-16th, 2026
It is time to research further about this problem. First is to try to find any similar research that attempts to solve this problem. There were many research that attempts to predict disaster, but no one tackled noise in moisture dataset. Awesome.
First, I needed a dataset to apply machine learning techniques. After countless searches, I found out that ECMWF provide ERA5 dataset which contains hourly moisture data from 1940 to present. The method that it processes the raw moisture data is that it takes raw moisture data, recalculate it by factoring data from satellite, radio station, etc…, and putting all of them into one formula to get final moisture that they THINK is the most accurate version of it (this process is called reanalysis).
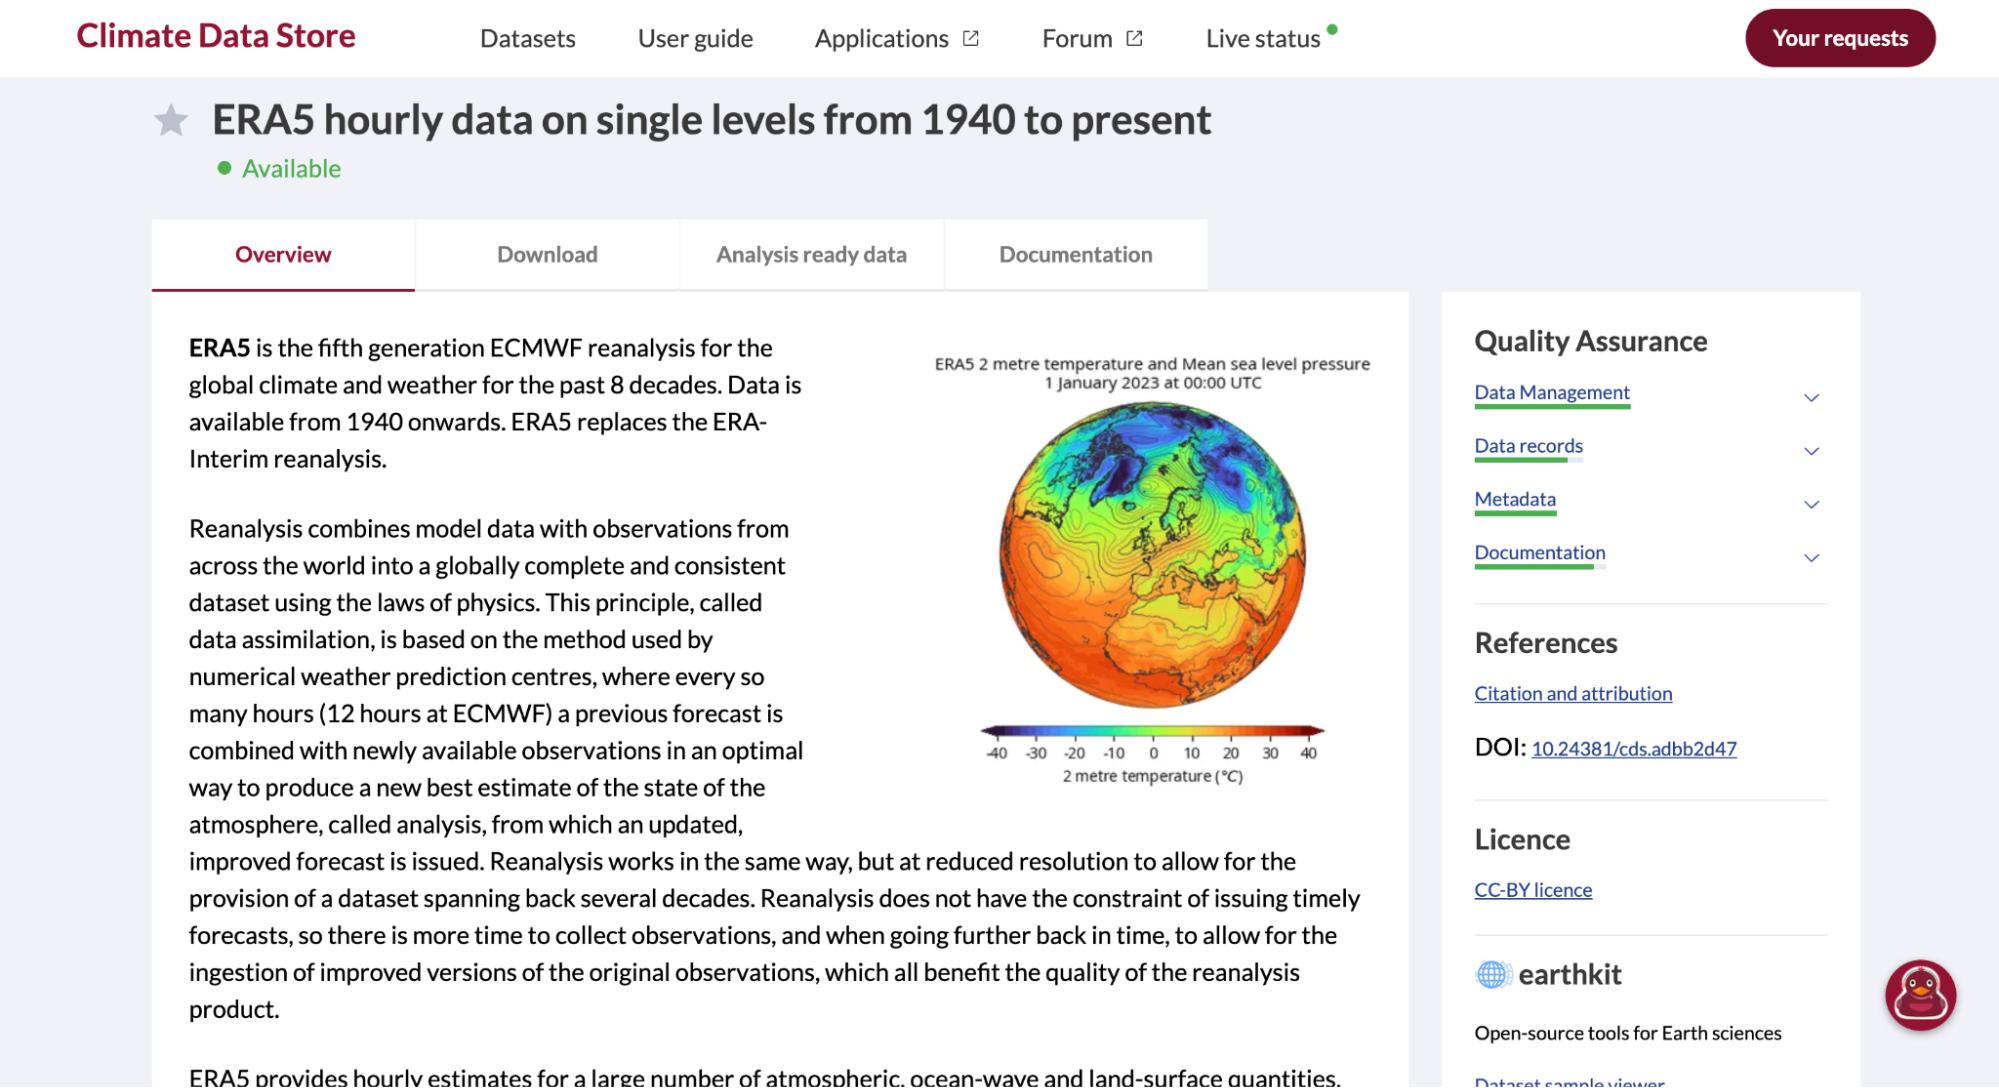
I decided to define the difference between the raw moisture data (also called ensemble member) as moisture increment (so-called noise). According to scientists, this moisture increment should be completely random and should not contain pattern. But are they correct (?) is the question.
January 17-18th, 2026
I initially tried to export the entire dataset from 1940 to the present and moisture data around the world. It took a heck of a long hours and realized my computer will die of age soon. Chaning plan! I will just analyze from 2019-2021 at 12 hour time interval at 3 elevation in western U.S.. This is still enough data (but not redundant) to apply machine learning.
I also changed the method I export a bit. Previously, I used the website itself to export the .nc file. However, because I encountered error, which i still couldn’t figure out why it happened. It said the download failed. So I thought “what if I just use API key to import it directly through terminal?” And yep! That’s what I did and I couldn’t successfully import the database which took several hours even after I reduced the scope of the dataset.
January 19-20th, 2026
First, I needed to mathematically define what moisture increment is. I think I mentioned previously, but the moisture data is recalculated with complete set of variable 12 hours later after the moisture data is retrieved. So, this is the simple formula:

where Δq(T) is moisture increment, q_analysis is the recalculated moisture and q_forecast is the raw data.
The first step is to measure if all the numbers are in the valid range and dataset is imported correctly. This is called sanity check. First is to check that all the imported pressure level and time stamps are correct. I had to search through some Youtube videos and ask GPT to learn and write this code:
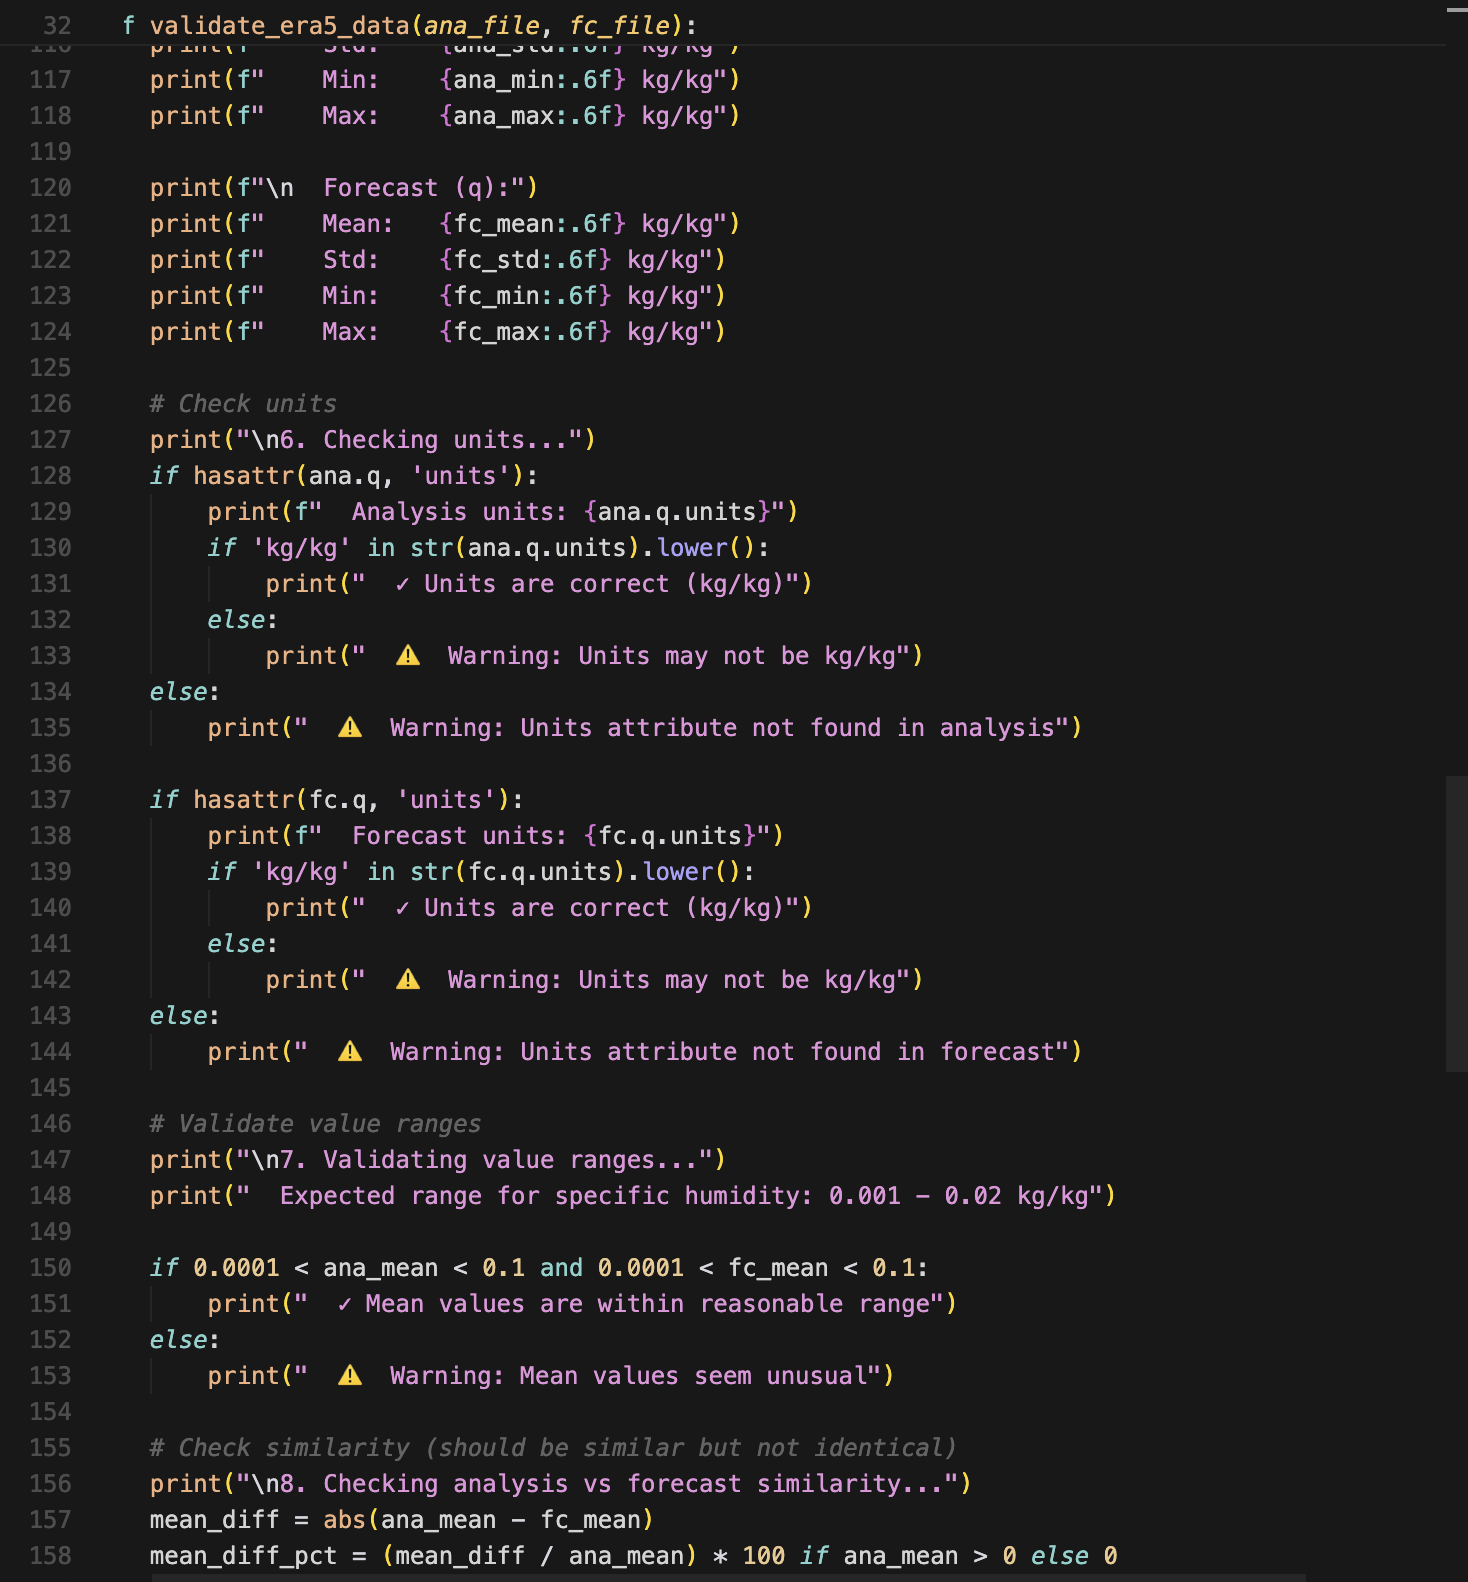
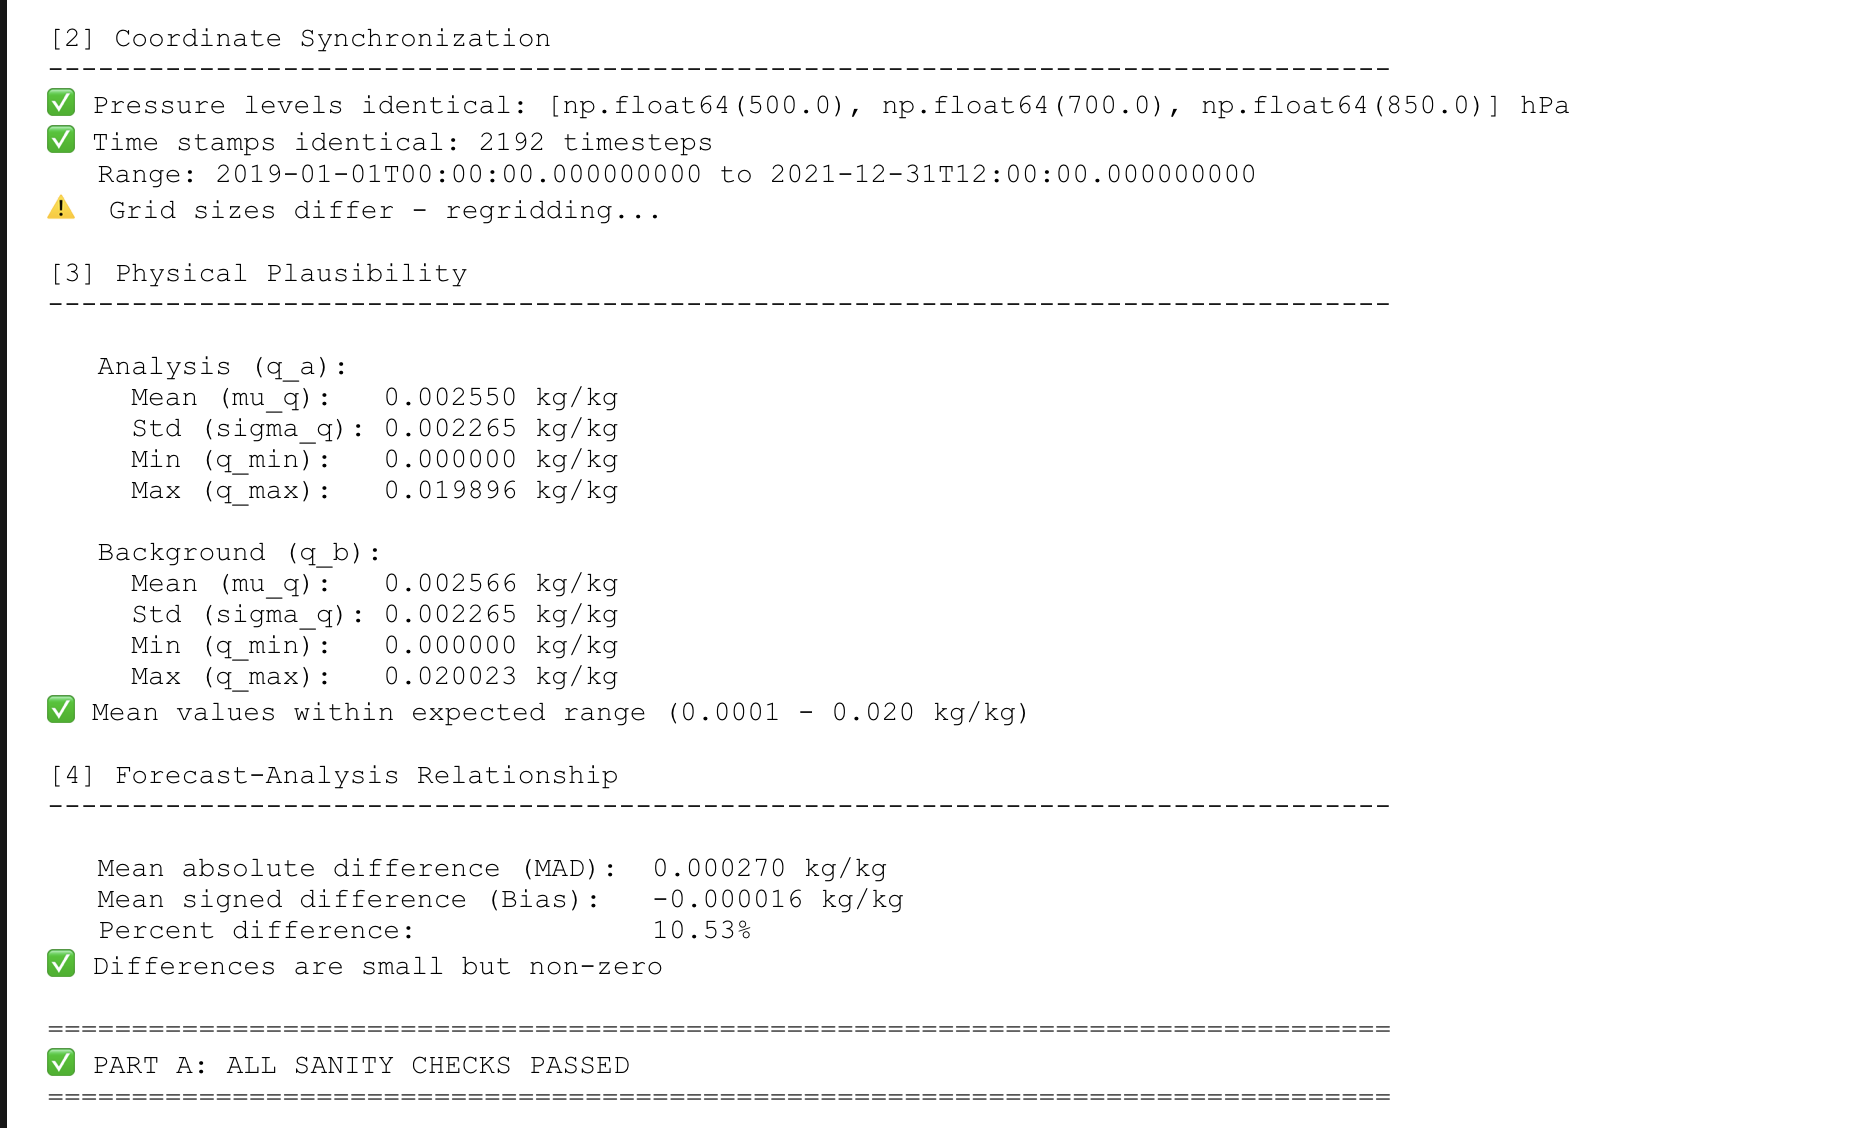
I also checked that all the ensemble members data are in the correct range and conducted simple data analysis to find out that analysis - forecast are in the normal range and make sure that they don’t have numbers too big or small. Here is the result.
January 21-22th, 2026
I first prepared data for all the moisture increments by subtracting forecast data from reanalysis data and putting it into a separate file. Before I actually find out WHAT pattern there is, I have to first find out WHETHER there is pattern or structure in the first place.
First is spatial recurrence analysis and connected-component geometry analysis. I won’t go into details but I am basically finding out if there is a pattern across the horizontal layer and if there are hotspots in moisture increment where similar values are grouped together in certain places. Second is the vertical coupling test. I am trying to find out that if there is correlation between the moisture increment value across multiple vertical elevations. Third is temporal persistence analysis. Basically, this checks if there is similar moisture increment value across the time.
Result was insane!!! And there is good news and bad news. Bad news first, it failed the spatial recurrence analysis and connected-component geometry analysis. This means that there is no horizontal pattern in moisture increment. I was devastated to be honest. But after few searches, I found out that it is because we used the Eularian approach than Lagrangian. Basically, it is that we observe the properties at fixed point. Since wind is something that moves really fast, I thought it made sense that there is no significantly measurable value. Yep. I got p-value of 1 and 0.3012 each.
Yep. This was unintended but understandable.
Good news. The last two test, vertical coupling test and temporal persistence analysis, succeeded with p-value of zero.
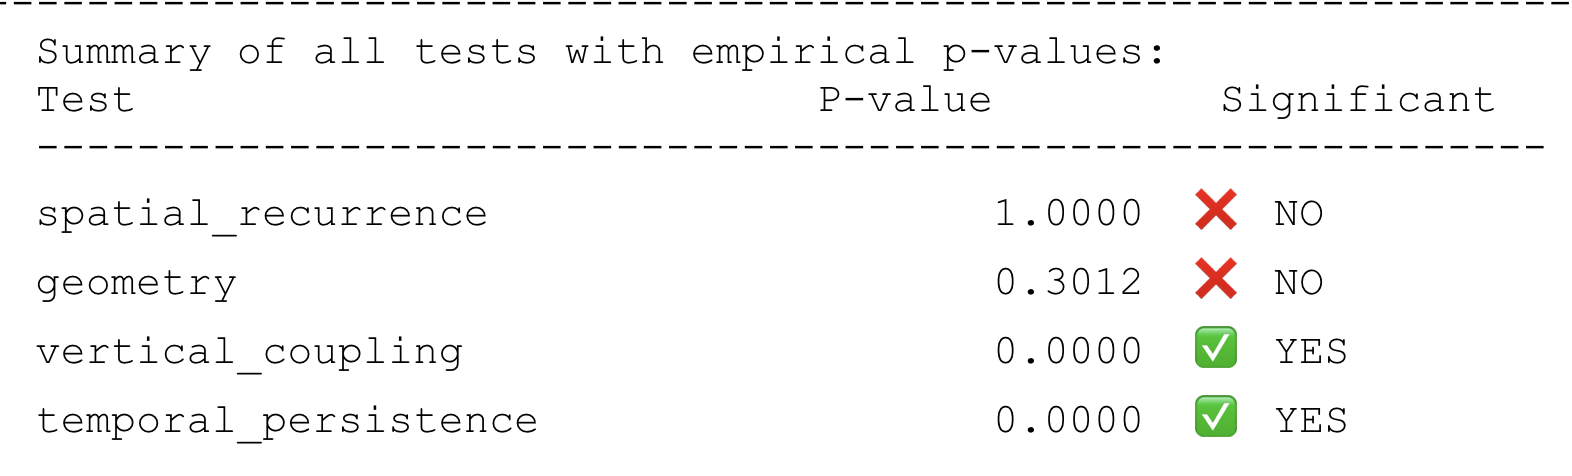
This makes it worthwhile for me to proceed to the next step of the process, which will be processing data into measurable one.
P.s. I didn’t document every single thing today but it was pretty messy work behind the scenes.
January 24-25th, 2026
I made a big big mistake. The thing is that the horizontal test both failed, in fact, very miserably. I thought, what if I used a different dataset? I spent a lot of hours searching. Here is what I learned: 1) There is no other great dataset like ERA5. 2) If the test fails in the ERA5 dataset, it will fail the same way for other datasets too.
Yep. I did this for two days.
January 26-27th, 2026
I am gonna stick with my plan. ERA5 dataset is good enough end I’m just gonna work with vertical and horizontal pattern.
The obvious next step was to process data for the machine learning process. The moisture increments were averaged over western U.S. and assigned with one “state vector” for each time step. After going through research paper and talking to GPT, I divided them into 8 different column metrics listed below.
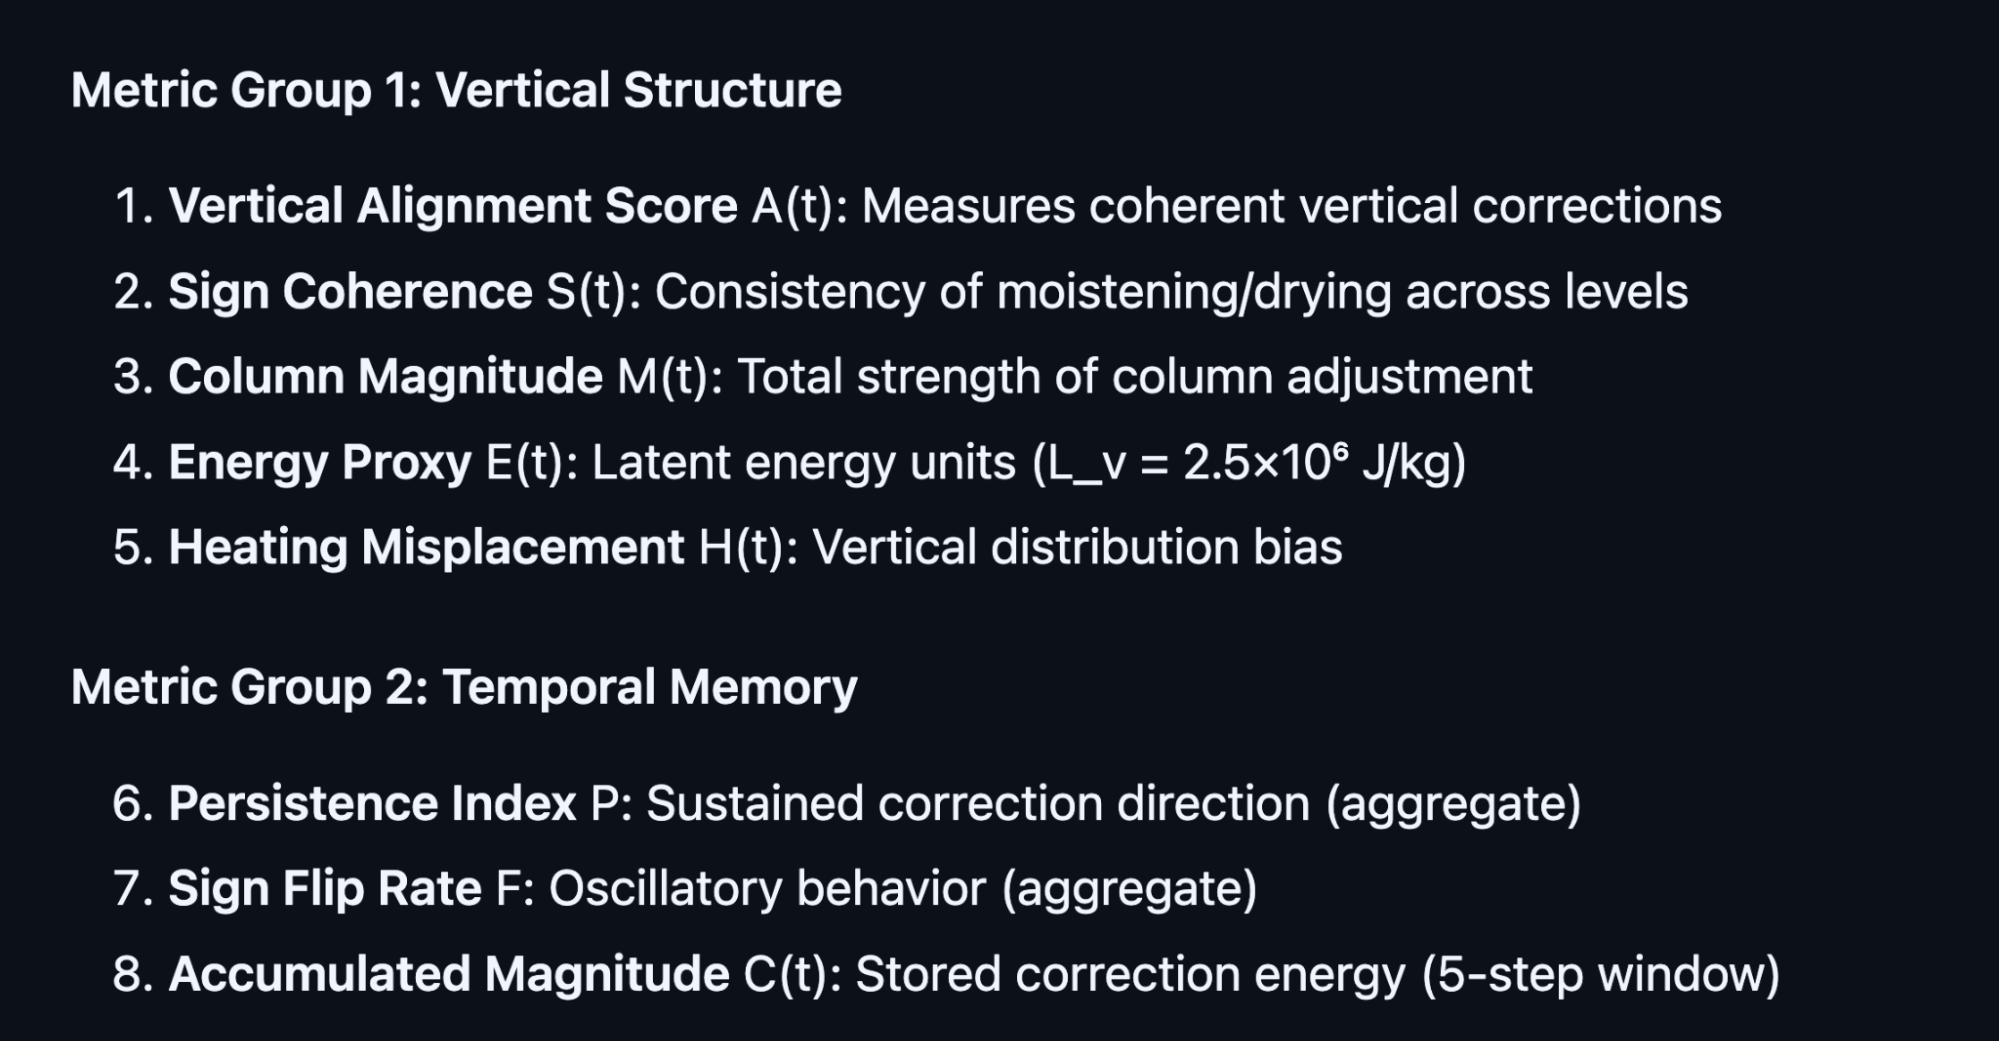
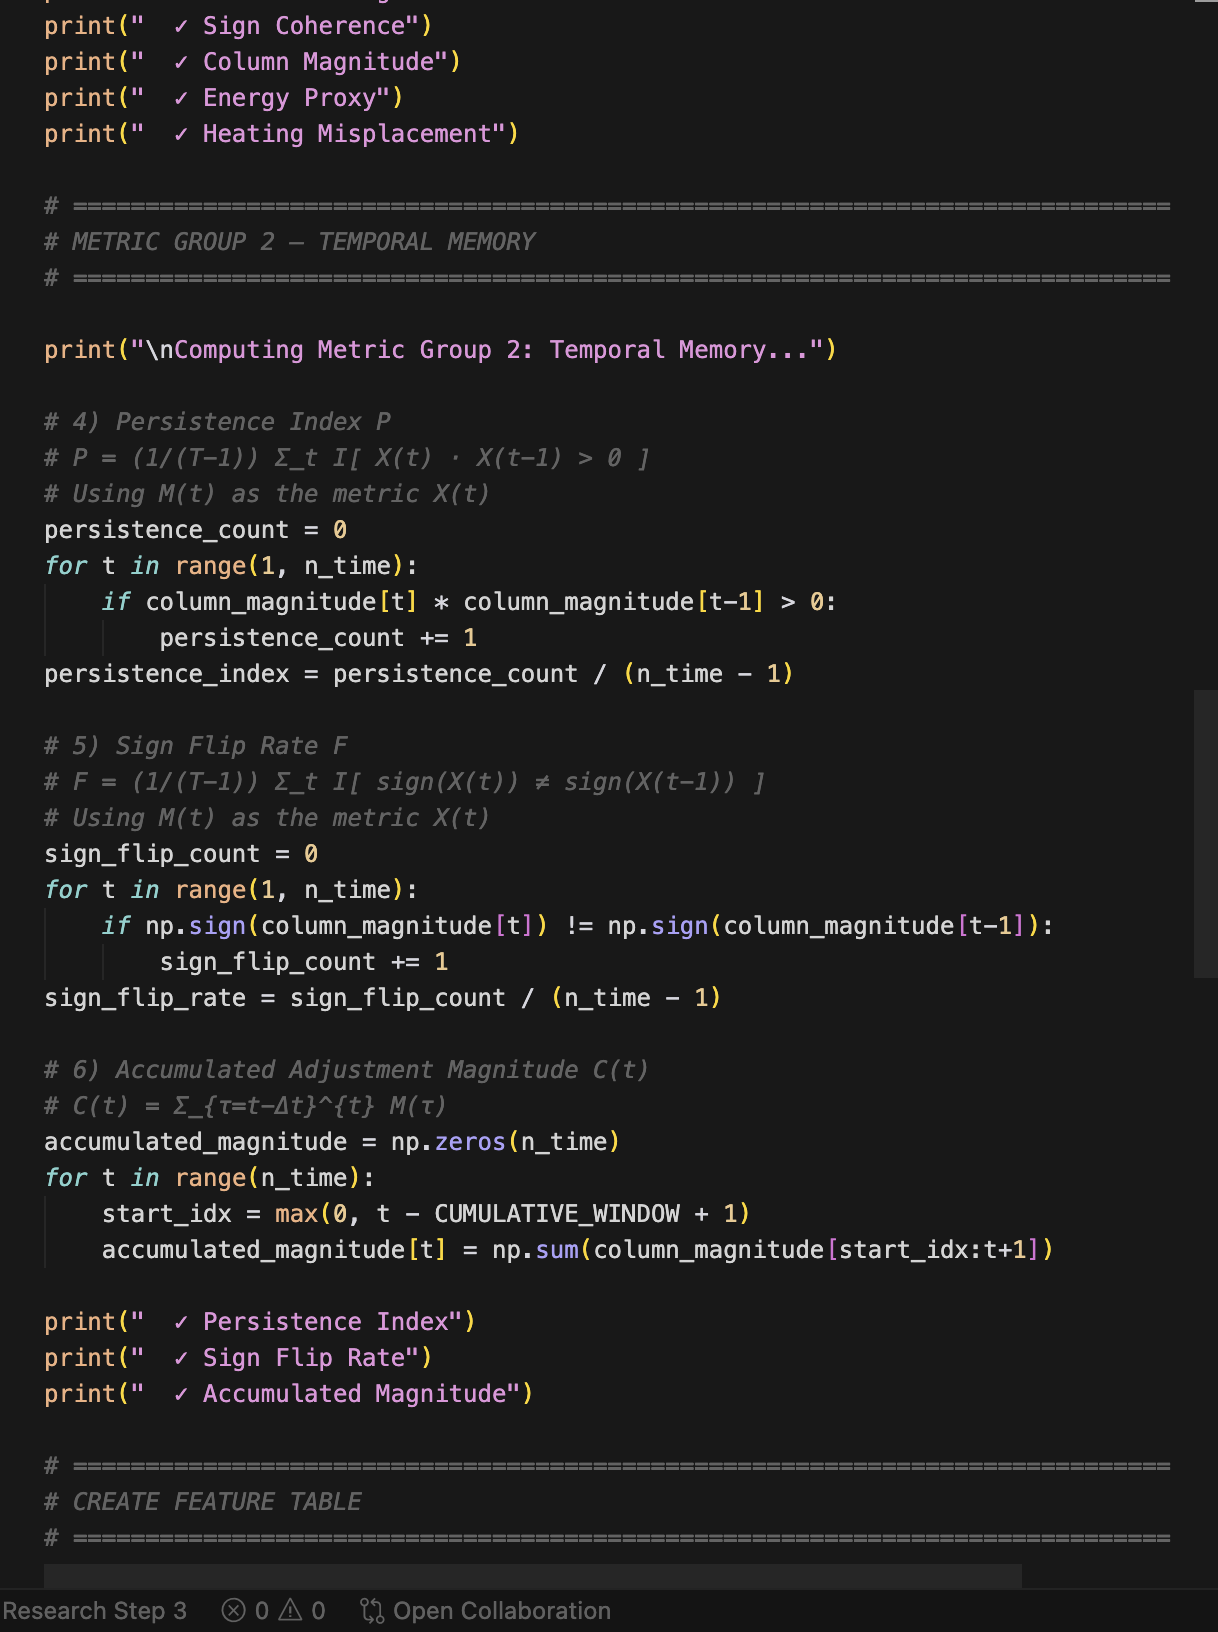
And, I wrote code for it to compute these with the real data:
I wanted to make sure that all metrics are formed so here is the visualization:
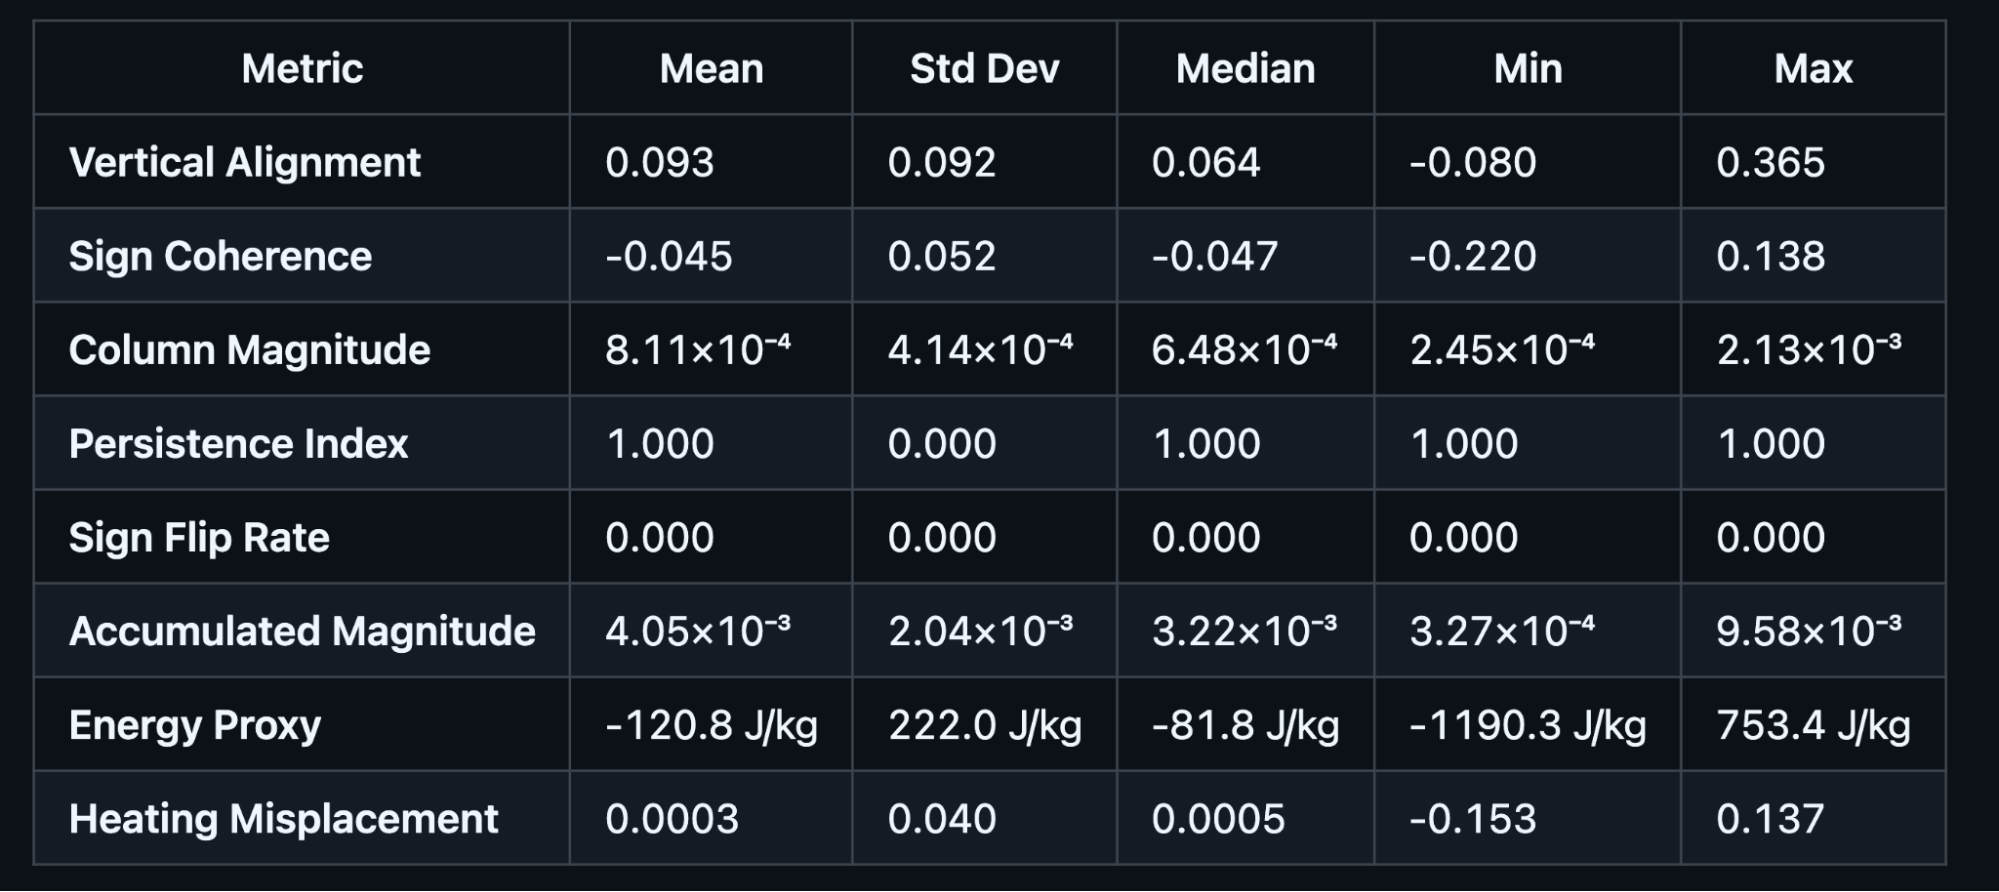
One mistake I made here is that I tried to compute the Persistence Index and Sign Flip Rate. PI is always non-negative so essentially, it can’t change a sign, which makes SFR also stay at 0. A small mistake here but it is not incorrect or anything so I decided to proceed.
January 26th, 2026
Right now, since all the metrics are out, it’s time to work on the machine learning part. I decided to use unsupervised machine learning since there is no clear label and it would be really interesting to see what AI outputs out of these metrics.
Through Google search, I found out that unsupervised machine learning groups the sequence of patterns into view groups, which is called regime. Now, I’m gonna use HMM, k-means, GMM, and SOM unsupervised learning methods to analyse the moisture increment metrics. Check out below image for details about the machine learning model.
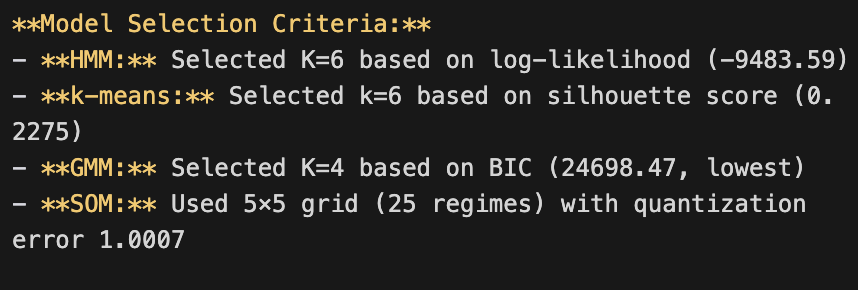
It took some minutes (faster than I thought though) to get the result. And the result was profounding. I am attaching few image for few models.
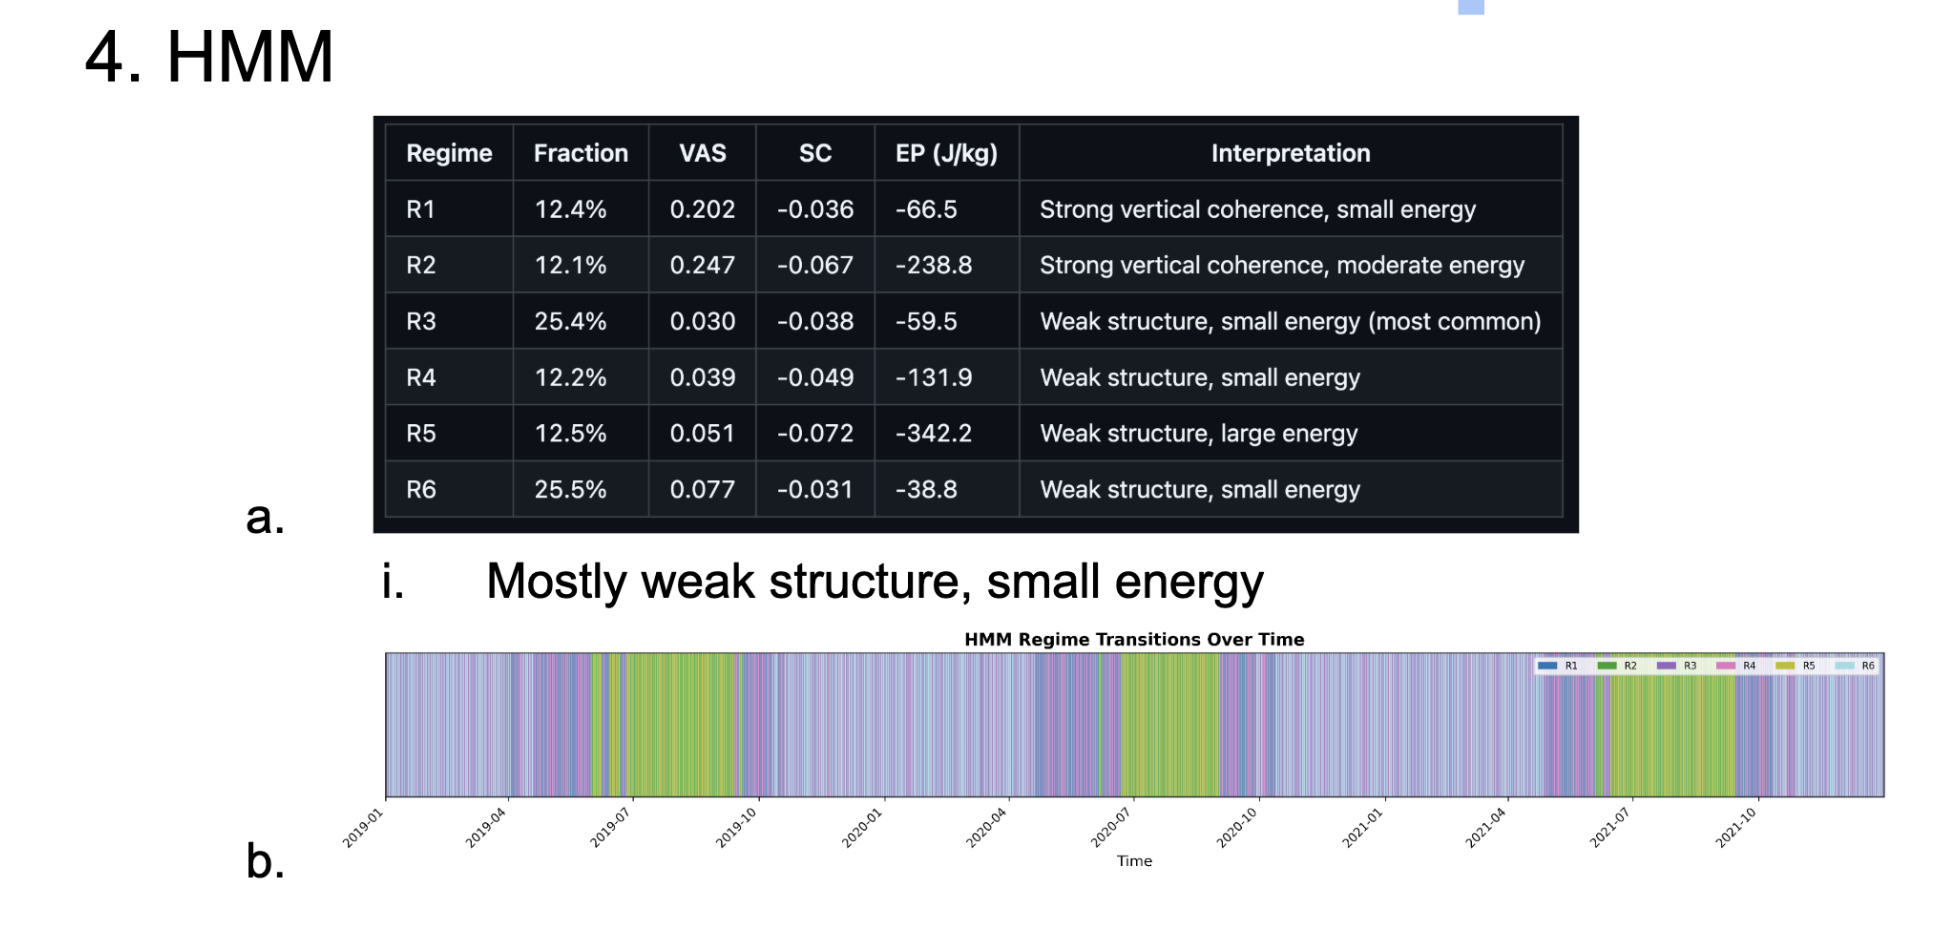
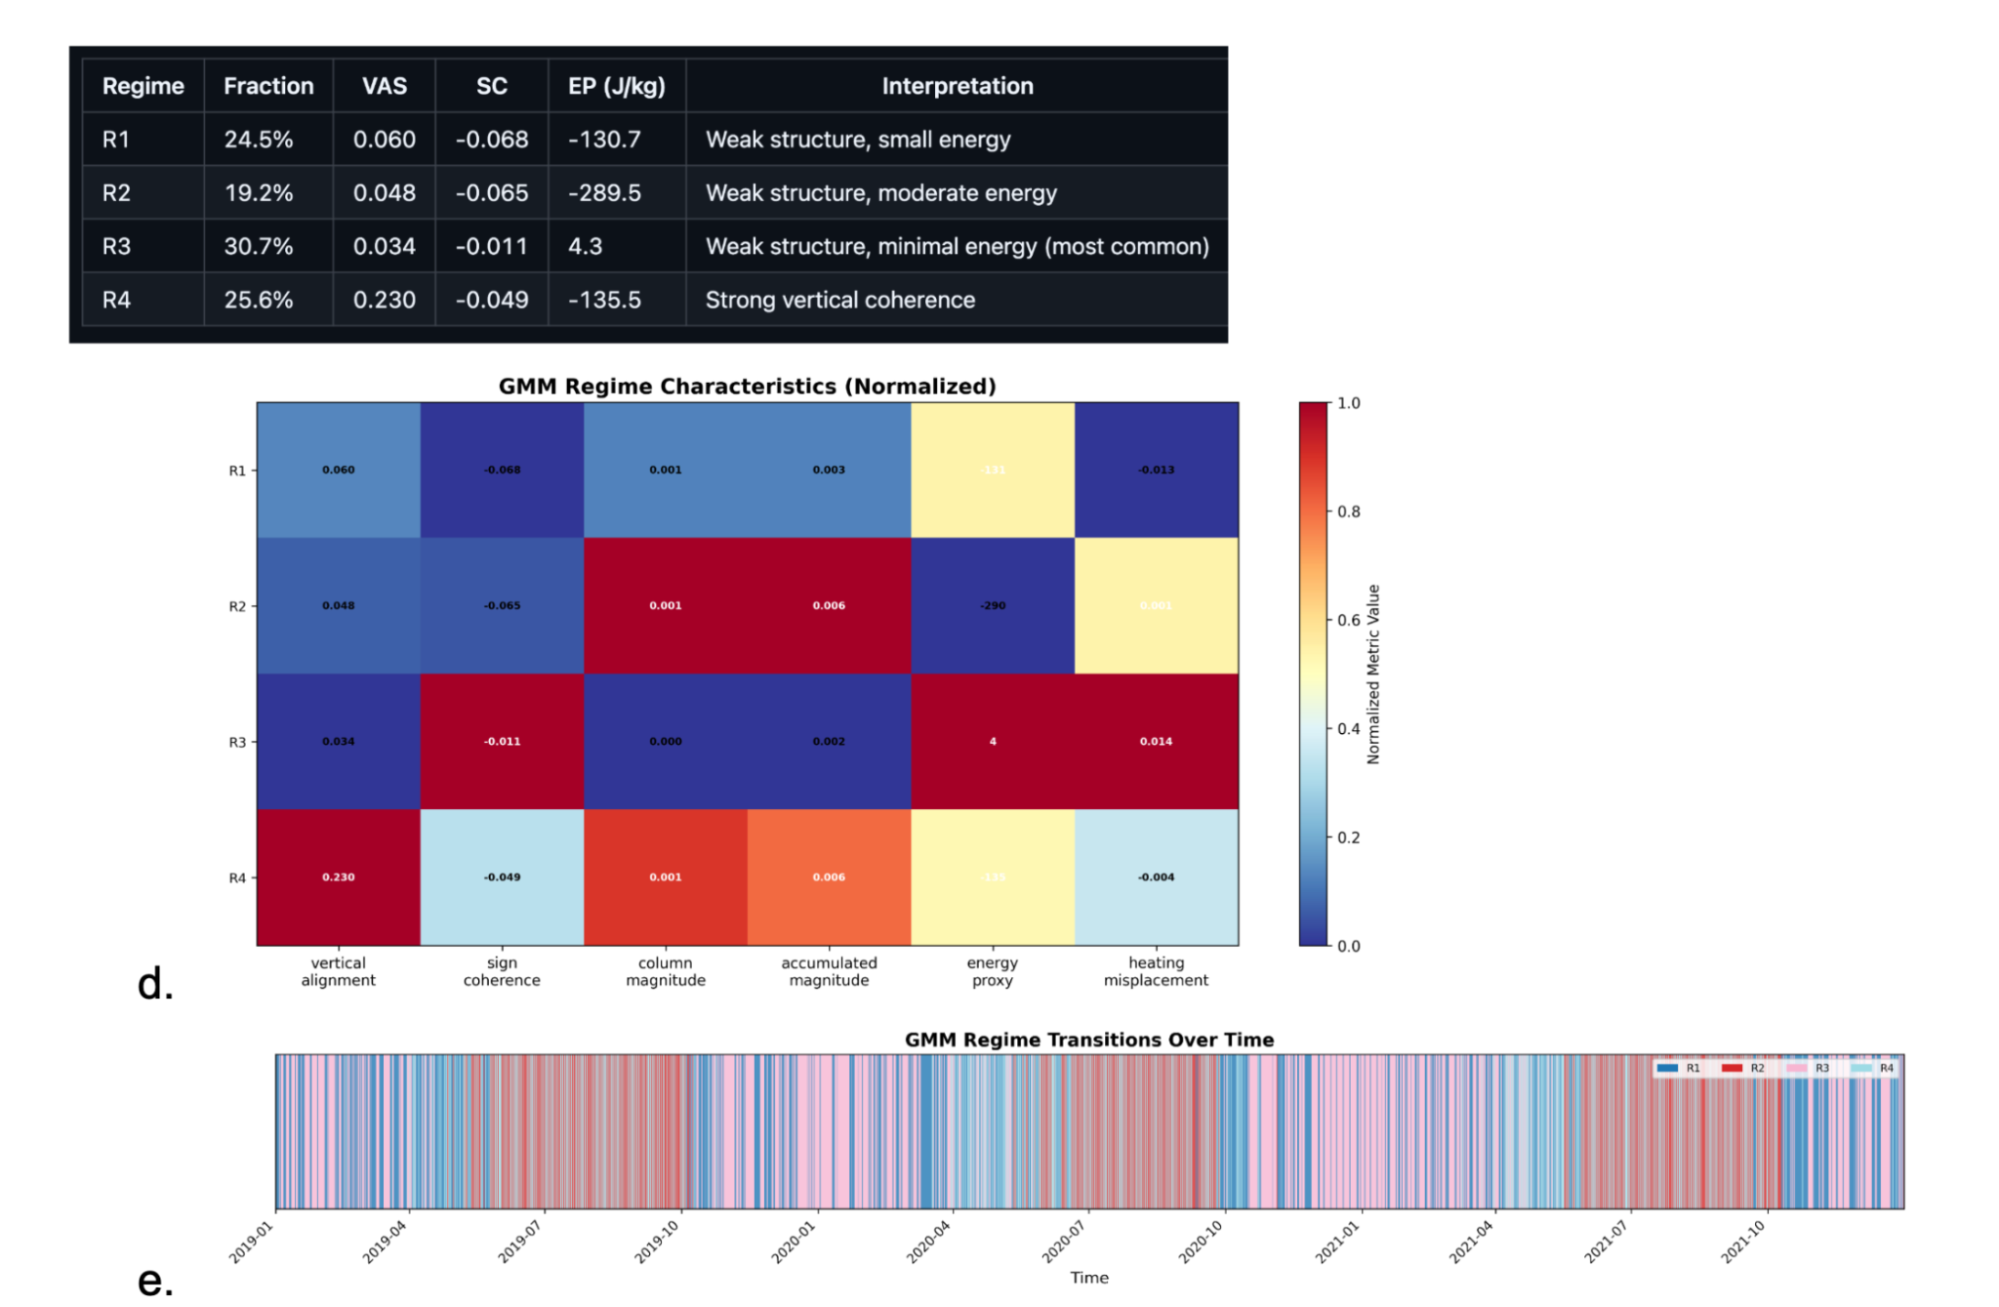
To summarize the result, I found a few interesting things. First, the most apparent thing is that the R2 regime, which carries the strongest column magnitude and accumulated magnitude, was frequent during summer. The interesting thing I found is that during the summer, most moisture related disasters happen. Winter shows minimal, independent corrections with very low energy adjustments, which correspond with the fact that moisture related disasters rarely happen during the winter. Of course, I have to conduct the next phase of research to find the definite result, but this interesting research makes me wait for tomorrow.
January 28th, 2026
I realized that I made a big mistake yesterday. The experiment I conducted was an increment I averaged over the entire range of regions. This makes direct localized relationship analysis between the moisture increment and extreme events at individual points impossible.
So, what I did was I didn’t averaged it over the scope and instead computed localized increment and performed the exact same process I performed yesterday. It did show similar, or almost same result. This is a modified summary of the regime characteristics.
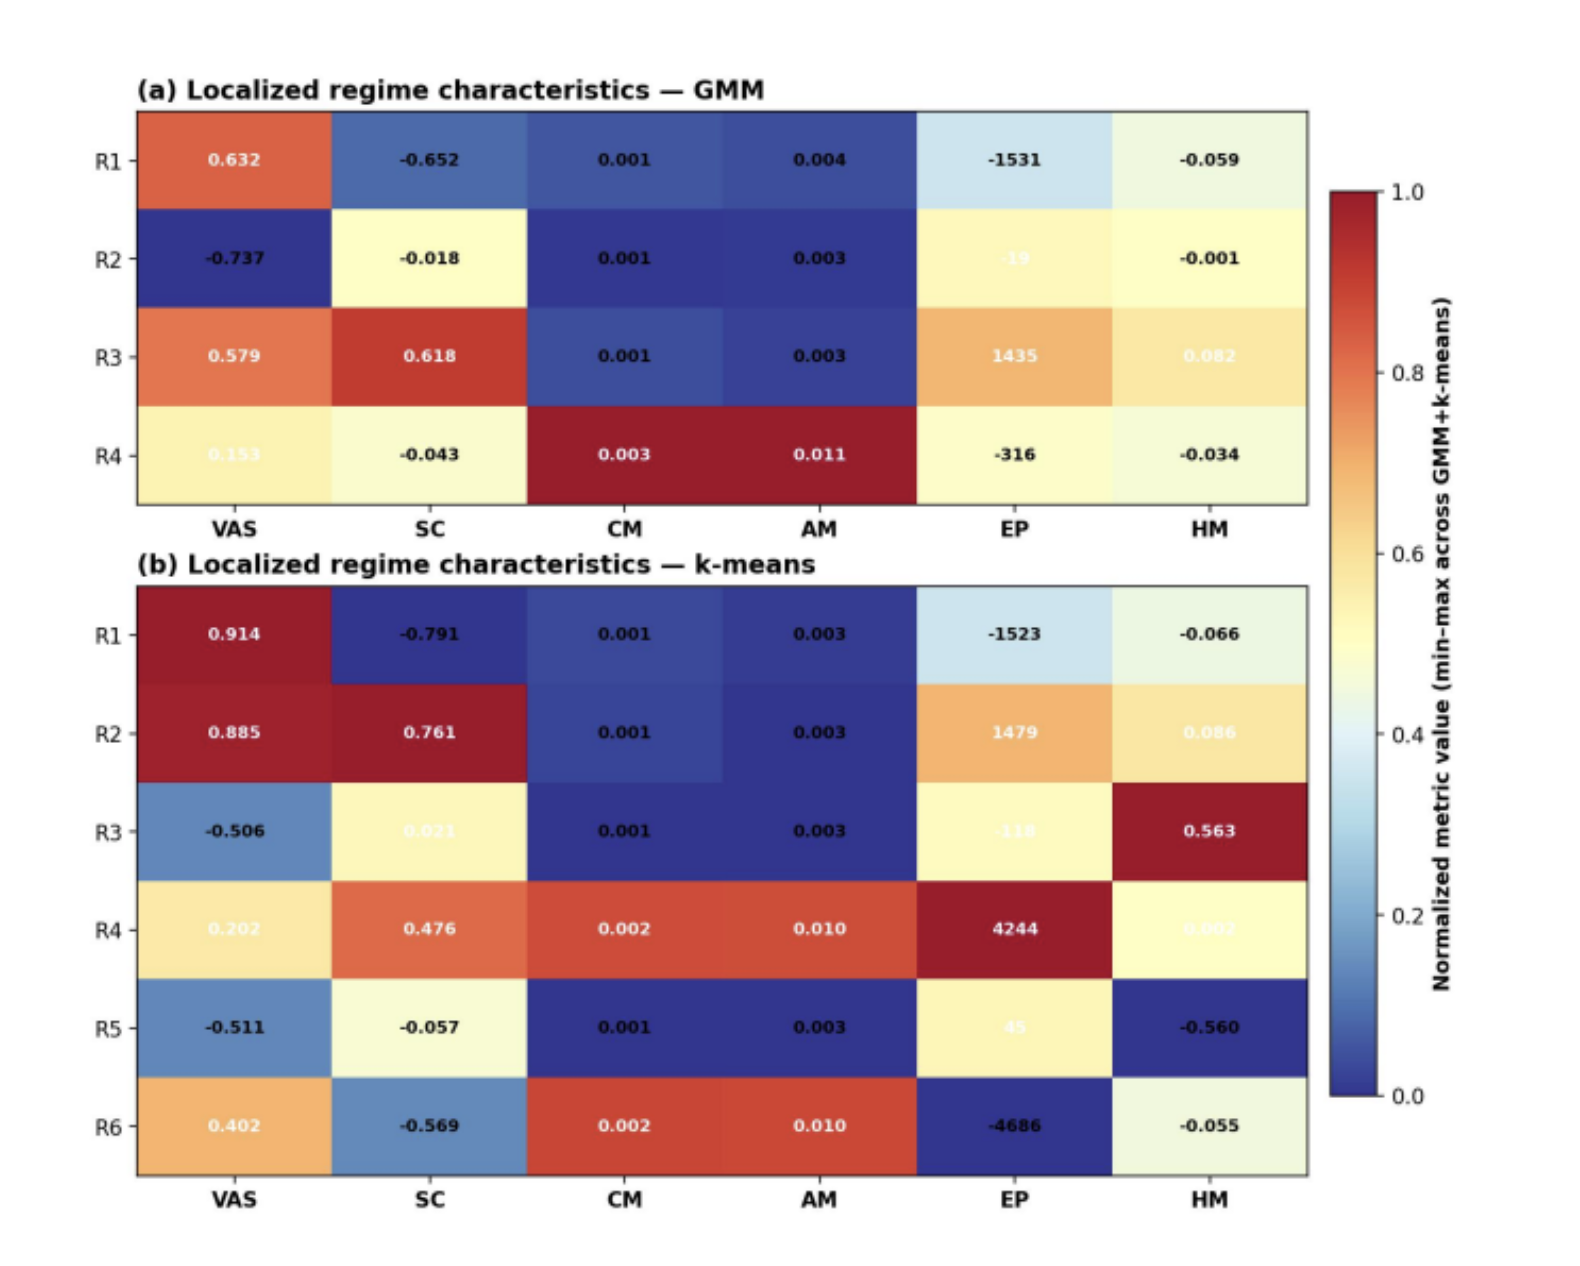
I guess I will conduct the next step of research in the meantime.
February 1-14st, 2026
I couldn’t write a lot of entries during this period. It was chaotic due to continuous failure and success and sorry that I couldn’t log every single failure and success. But below is the final conclusion I’ve reached.
Now, I have to relate this to extreme conditions. What I did first is downloading this dataset: NOAA storm events database. And I conducted logistic regression and random forest that kinds the pattern in timing of the extreme events and each regime. Nothing special came out. I wondered at first why this result came out. Later I found out that the NOAA storm events database is mainly human-reported. It is a database of all the dates and descriptions of human-reported disasters, which is measured in terms of financial and material damage.
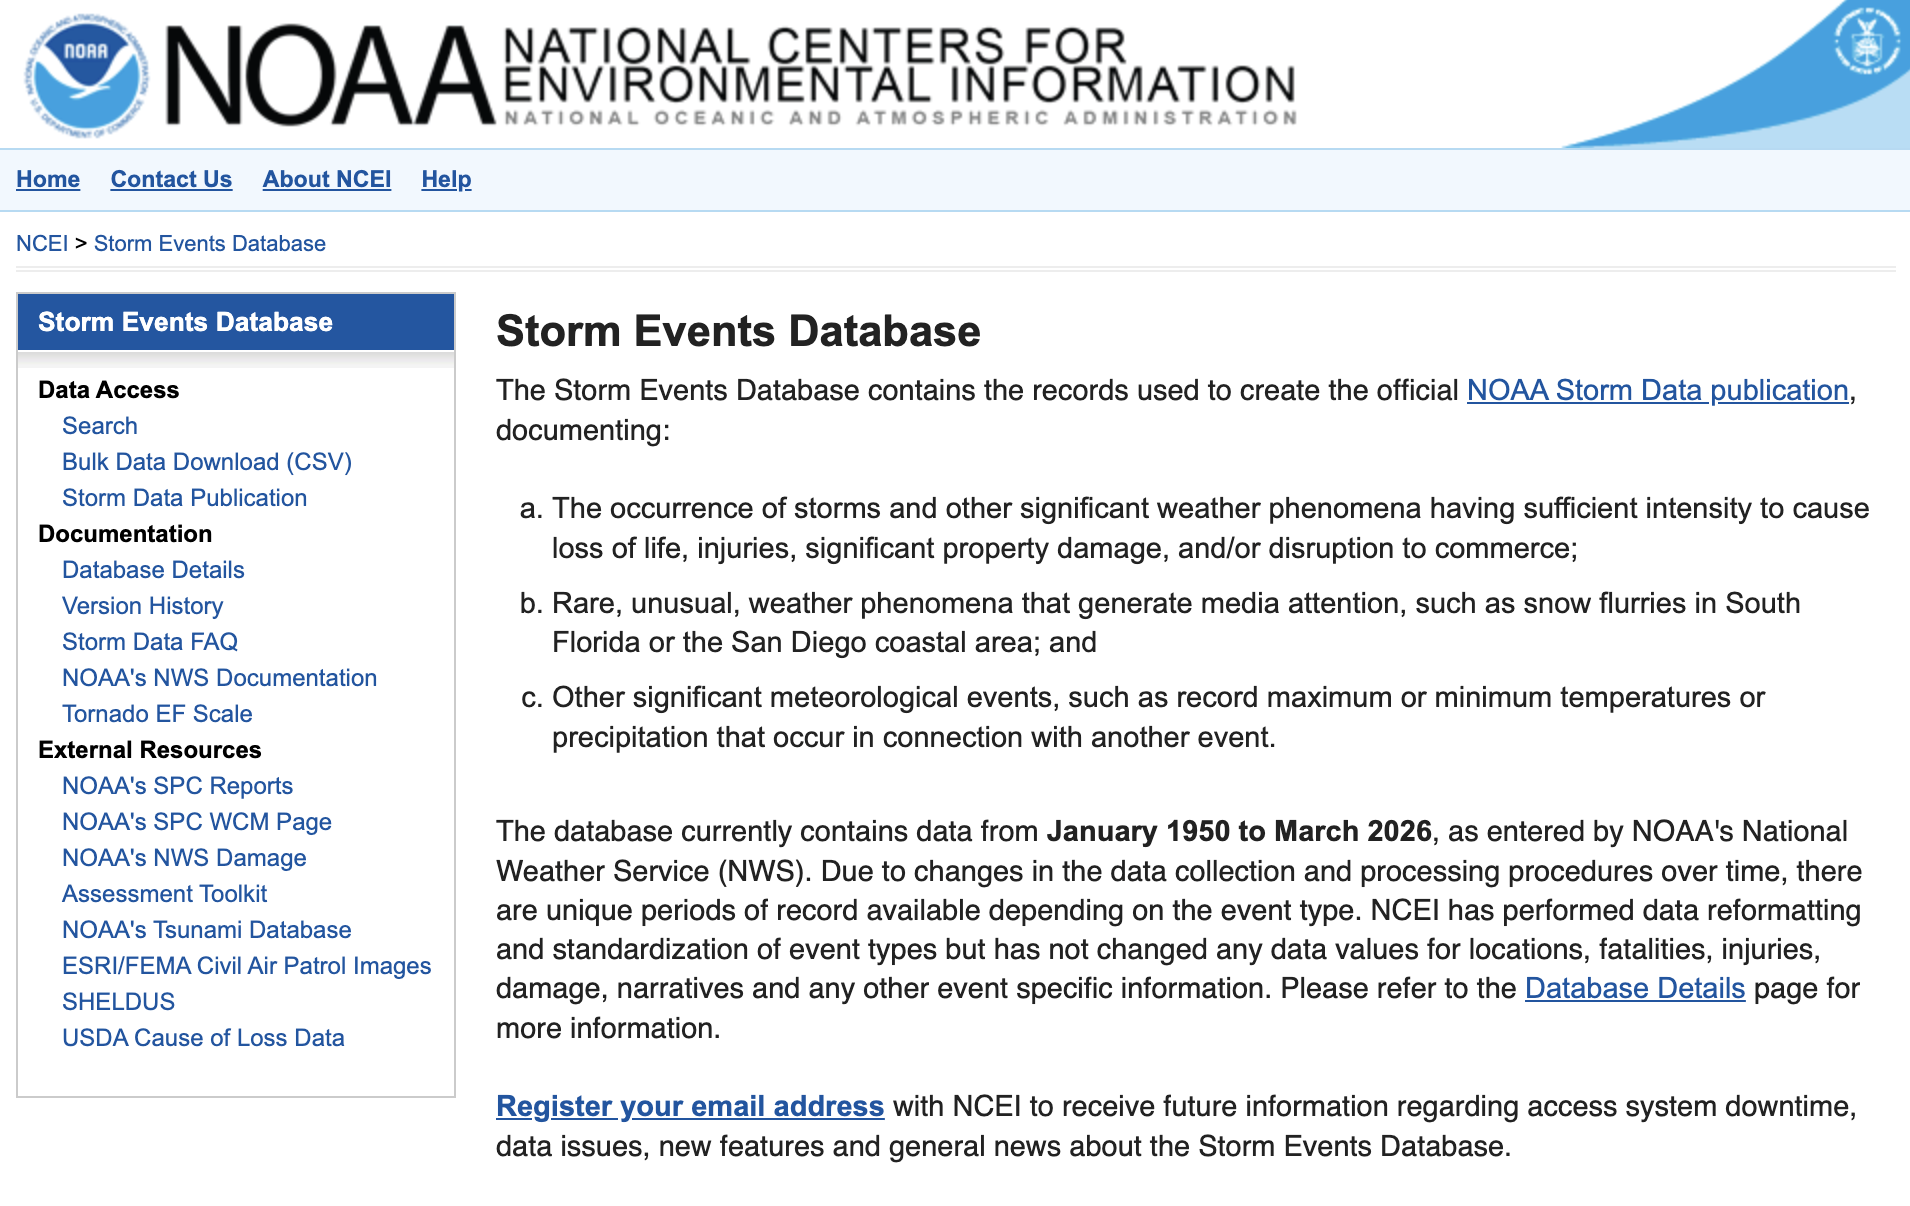
I quickly switched to the ERA5 dataset. I defined storm by when CAPE, Convective Available Potential Energy, is above 99th percentile. I defined flood by when total precipitation ≥ 99th percentile.
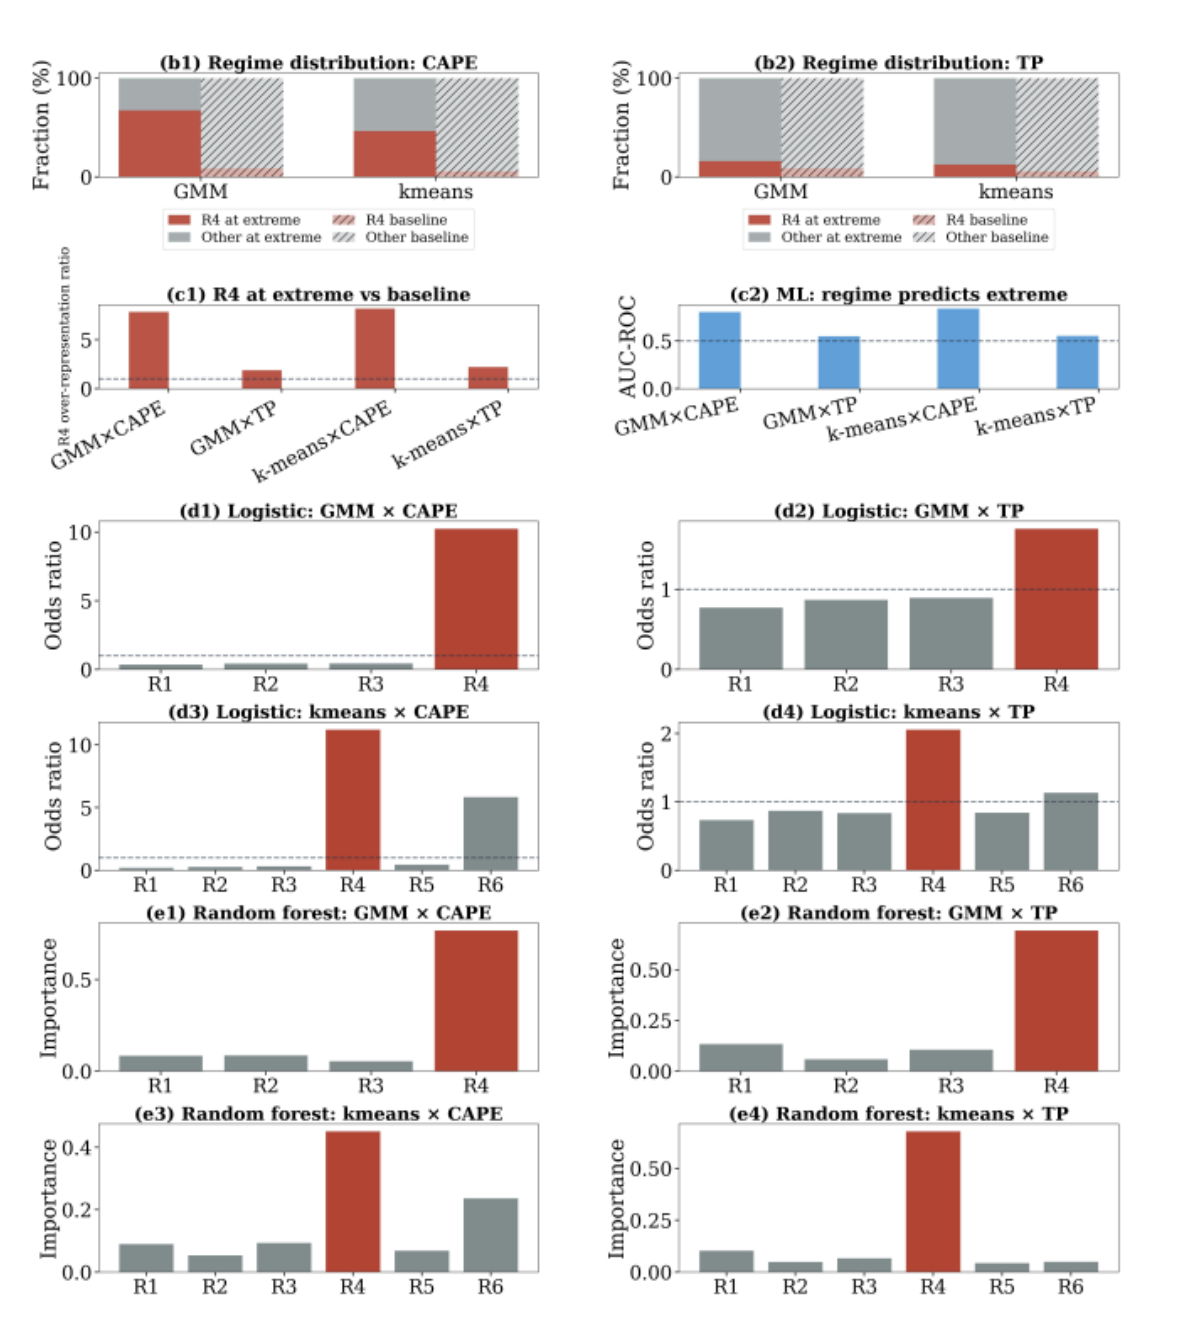
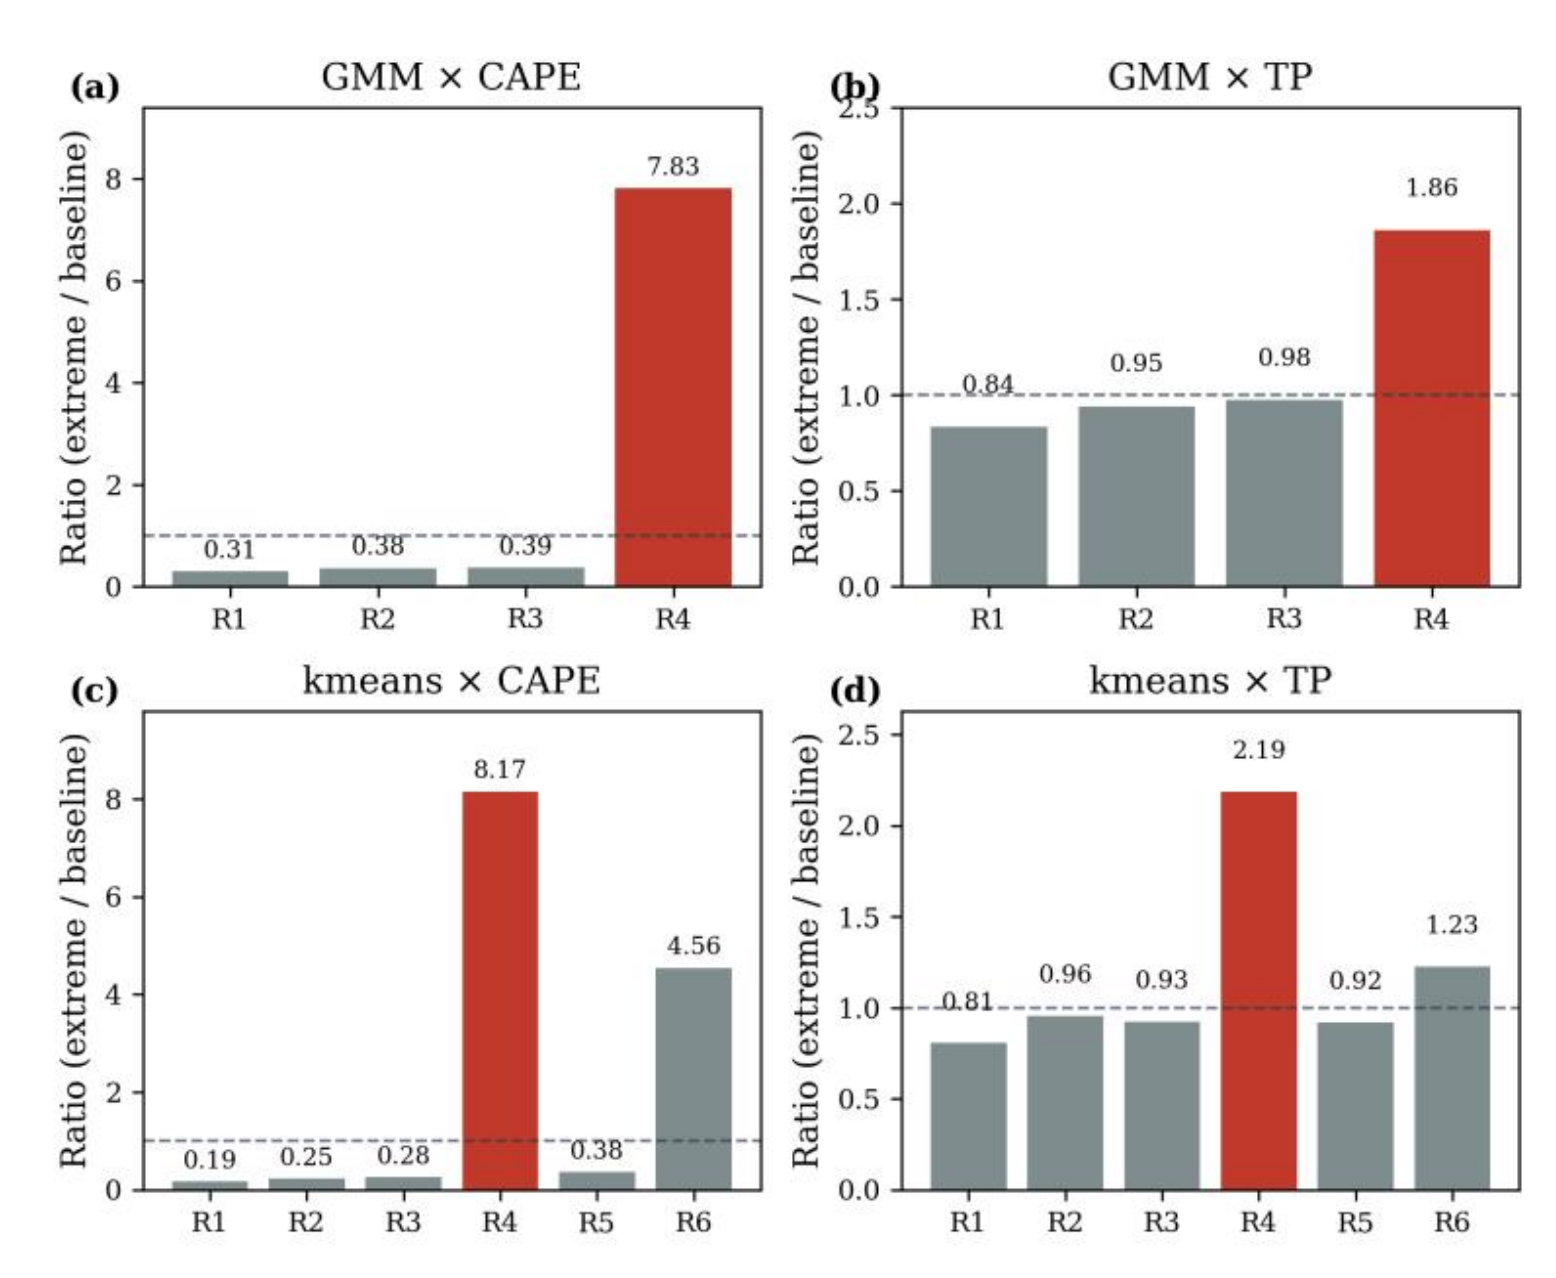
Afterward, I performed logistic regression and random forest to find out if there is correlation between certain regime and event. The result was profounding!
R4 regime, which was high magnitude increment with vertical alignment in increment, was the most correlated with extreme events. This is profounding because it means we can use R4 as a diagnostic tool for the extreme events, and this is something that no one have ever discovered before.
There is a big limitation, however. The correlation peaked at lag-0, which means that it is very hard to act as a predictive signal.
Afterward (from Febuary to June)
Afterward, I did few things to refine my research paper. One of them is reaching out to professors. I’ve sent hundreds of these emails to listen to feedback from professors.

One email I received back was from Professor Emanuel:
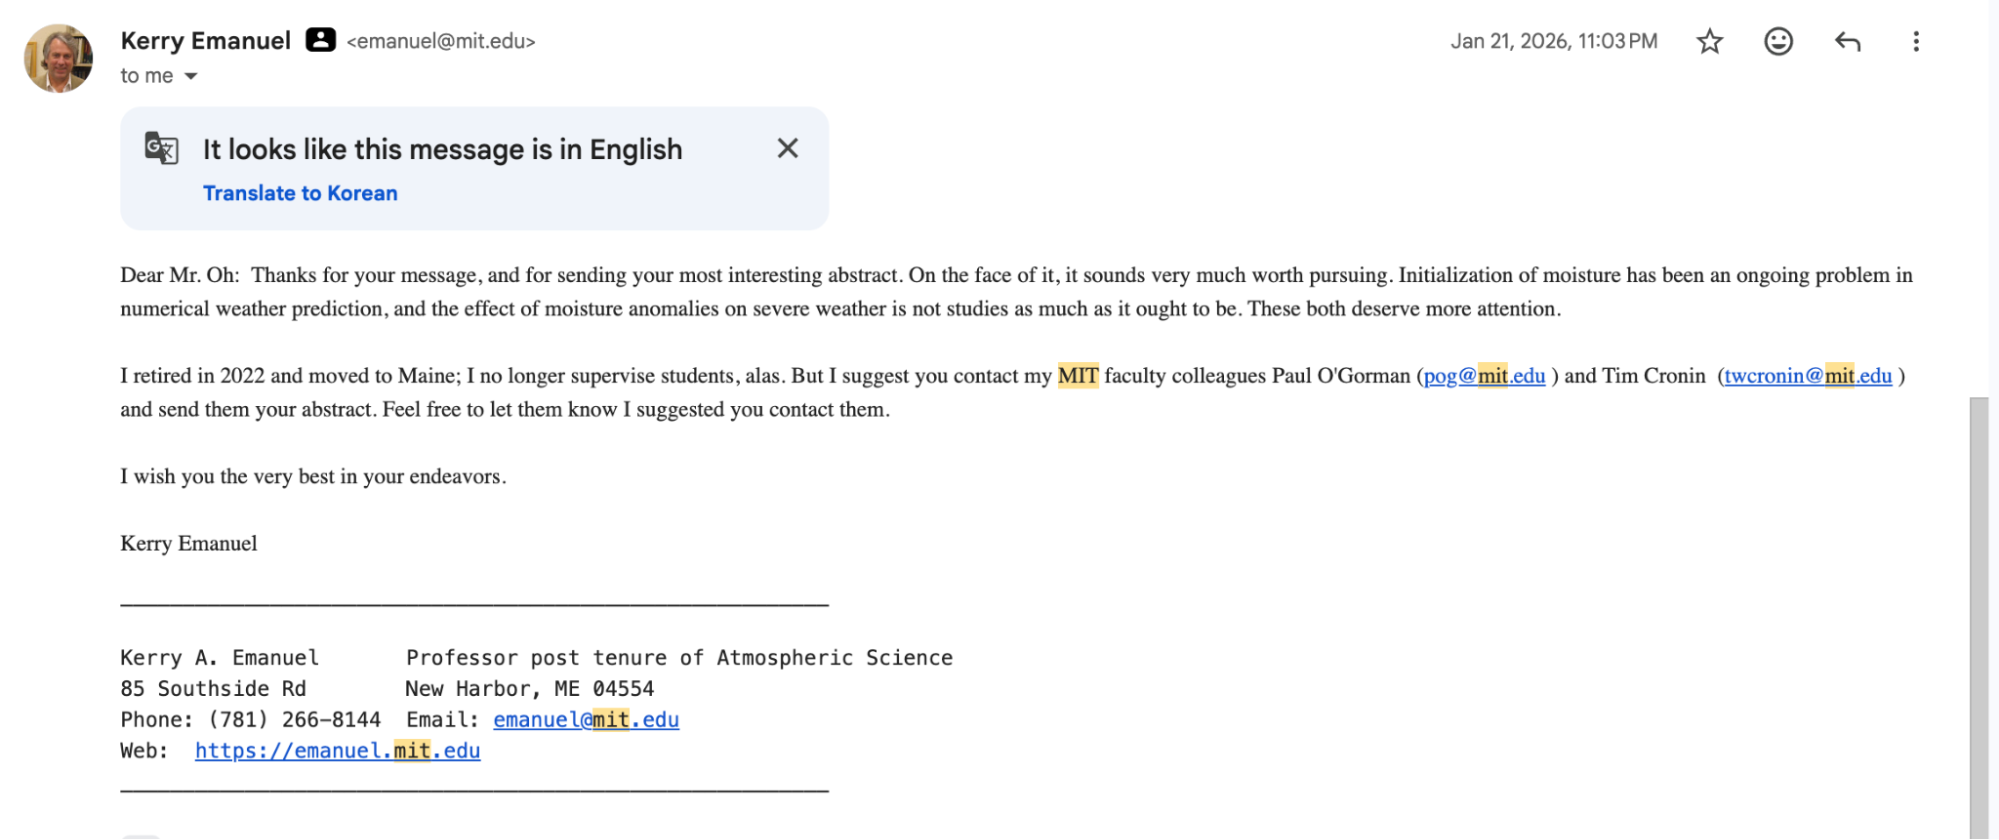
This led me to reach out to Professor Paul O’Gorman, land a 30 minutes meeting, and get a lot of valuable insights.
Except mentioned, I spent countless hours just proofreading and refining my paper.
Afterward I submitted this paper to IEEE and my paper actually got published!!!
You can take a look at here!
P.s. Here is the link for lab report and presentation that summarizes everything if you want to look into it.